
From 35% ACoS to 8.22%, while revenue more than doubled.
One UK private-label account. One continuous engagement. Seller Central and Advertising Console screenshots, shown period by period rather than reduced to an unsupported headline.
Verified account snapshot
June 2026
8.22%
ACoS
12.20x
ROAS
£182,492
Ordered product sales
<2.5%
TACoS
Sources: Amazon Seller Central and Amazon Advertising Console. No Sellerboard, net-profit or estimated-payout data is published.
A seven-figure UK brand with an efficiency problem.
The opportunity was not to choke spend until ACoS looked better. It was to rebuild how paid traffic, organic relevance and listing conversion worked together.
The account is a private-label packaging and disposables brand managed under NDA. When the engagement began, ACoS was approximately 35% and campaign reporting blended traffic with very different jobs and economics.
The objective was simple to state and harder to execute: protect sales velocity, remove waste, improve query-level relevance and create a structure that could scale without ad spend rising at the same rate as revenue.
The case study below covers one account only. Agency-wide experience is shown separately so the two types of proof are never mixed.
Category
Packaging and disposables
Marketplace
Amazon UK
Engagement
Managed continuously since March 2022
Category
~35% ACoS and blended campaign structure
Category
Seller Central and Advertising Console
The result is not one good month. It is consistency, scale and efficiency.
Every number below belongs to this single UK account. Dates and source screens are available in the proof section.
35% → 8.22%
ACoS reduction
From the starting position to July 2026.
£908,112
H1 2026 ordered product sales
Seller Central, 1 January to 31 July.
+100.9%
H1 year-on-year growth
Compared with £340,172 in the same 2025 period.
£918,370
Full-year 2025 sales
81,103 order items and 94,648 units.
12.20x
July 2026 ROAS
Alongside 8.22% ACoS and £0.57 CPC.
£24,170
Full-year 2025 ad spend
High revenue on controlled advertising spend.
Chapter 1
Consistency
Efficiency improved without relying on one isolated reporting window.
ACoS moved from 11.72% in March to 9.88% in April, 8.17% in May, 7.82% in June, and 8.22% in July. CPC stayed in a controlled range while ad sales increased.
This matters because one low-ACoS month can be manufactured by cutting spend. A sustained sequence is harder to fake and more useful for judging whether the account structure is actually improving.
Chapter 02
Scale
H1 sales reached £908,112, compared with £450,172 one year earlier.
Seller Central shows 73,227 order items and 84,518 units during the first half of 2026. Ordered product sales increased by 100.9% against the same period in 2025.
The account did not trade scale for efficiency. During the same period, ACoS moved deeper into single digits and TACoS remained under 3% in the best measured months.
H1 2025
£450,172
Same-date-range Seller Central comparison.
H1 2026
£908,112
100.9% year-on-year growth.
Chapter 03
Efficiency
Campaign architecture came first. Bids came second.
The account was rebuilt so branded, generic, competitor and discovery traffic could be read and managed separately. Each layer had a different job, budget logic and efficiency target.
That structure created the conditions for weekly search-term hygiene, query-level keyword strategy, placement control and listing improvements to work as one system rather than disconnected tasks.
01 · Structure
Traffic separated by intent
Brand defence, generic growth, competitor conquesting, category targeting and discovery stopped sharing one blended result.
02 · Search data
SQPR-led keyword strategy
First-party query data connected paid visibility, organic position and purchase behaviour.
03 · Hygiene
Weekly search-term review
Non-converting terms were contained and proven queries were promoted into controlled exact-match campaigns.
04 · Economics
Targets set by product margin
Campaign decisions were judged against what each product could afford, not one blanket ACoS target.
05 · Conversion
Ads and listings aligned
Search terms that generated useful traffic informed listing relevance, copy priorities and image strategy.
06 · Reporting
Paid and total sales read together
ACoS, TACoS, CPC, ad sales and Seller Central revenue were reviewed in the same operating rhythm.
The source screens behind the case study.
Select any image to view it at full size. Account-identifying information is excluded under NDA.
Published proof uses Amazon Seller Central and Amazon Advertising Console only. Confidential net-profit and estimated-payout screens are not shown.
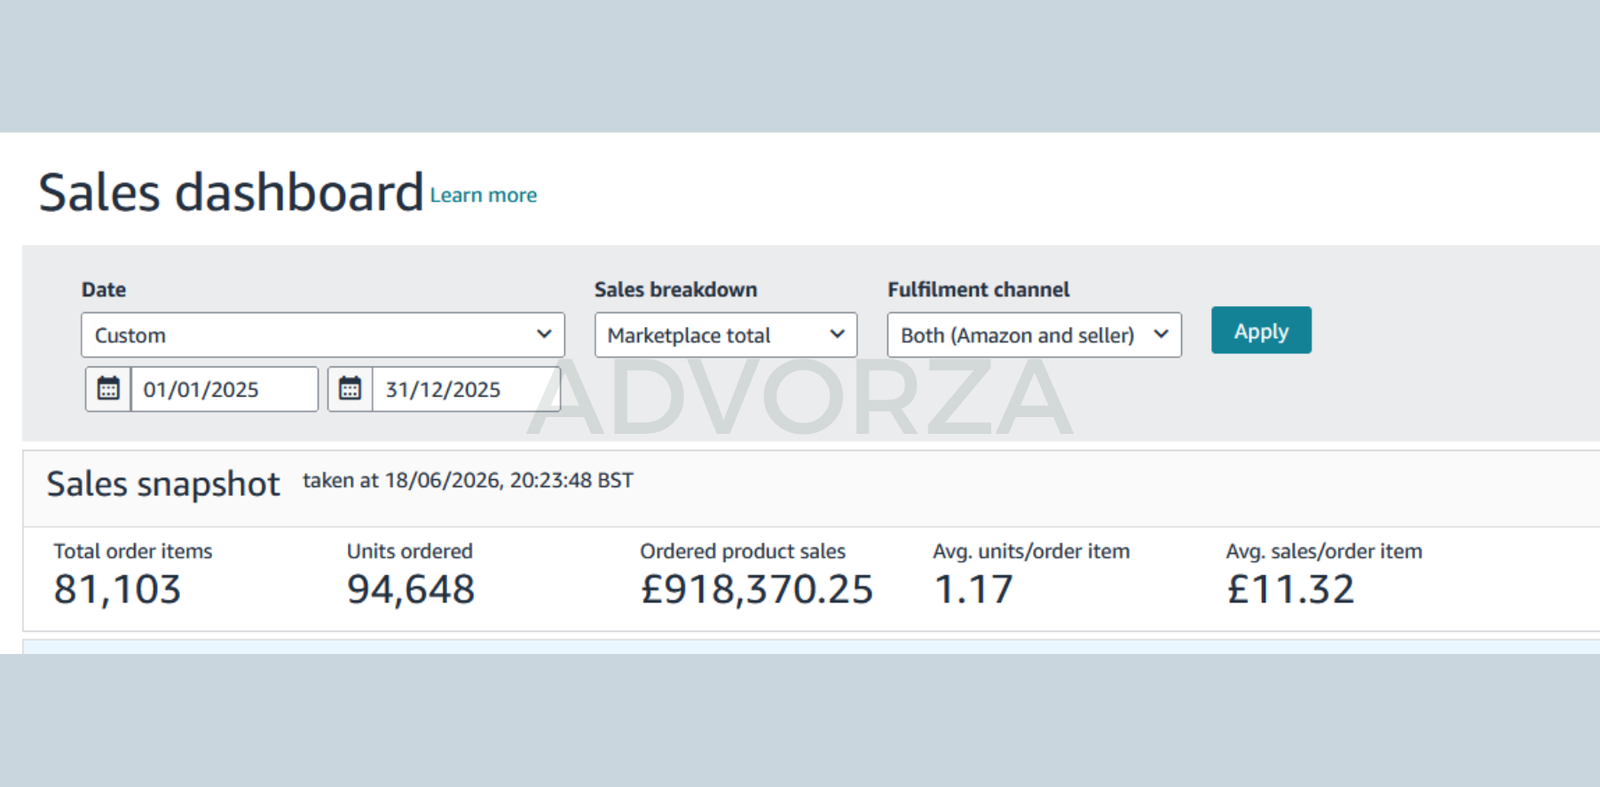
Full-year 2025
£918,370.25 ordered product sales, 81,103 order items and 94,648 units
Seller Central
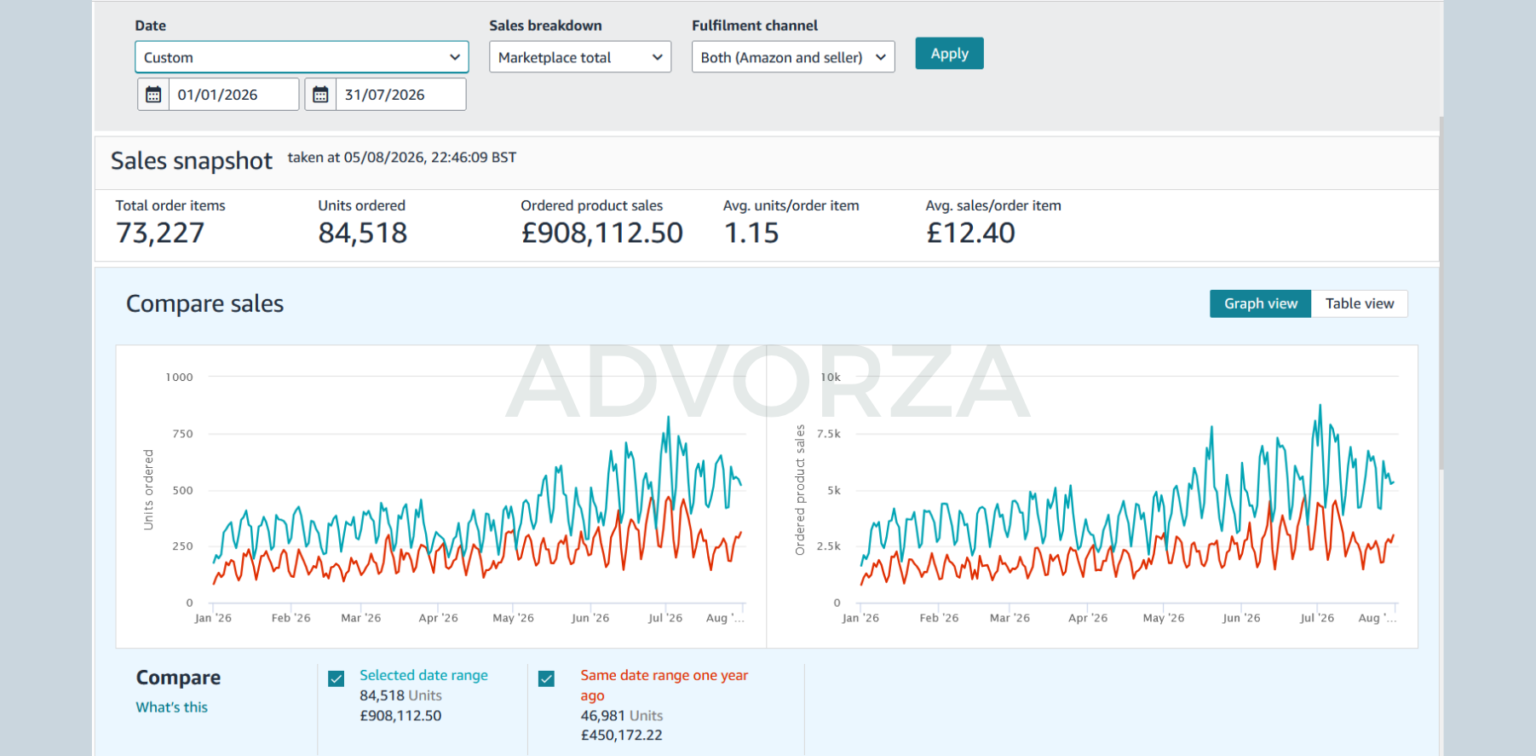
H1 2026 versus H1 2025
£908,112.50 versus £450,172.22, an increase of 100.9% year on year.
Seller Central
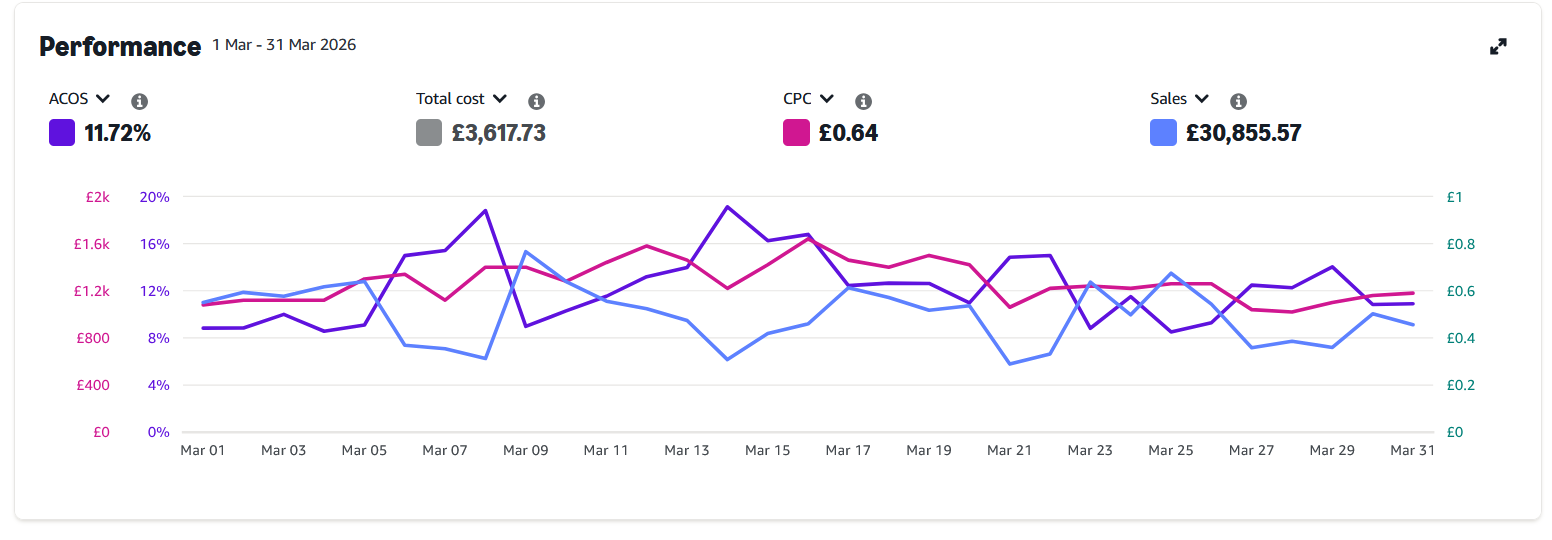
March 2026 PPC
11.72% ACoS, £0.64 CPC and £30,855.57 in ad-attributed sales.
Advertising Console
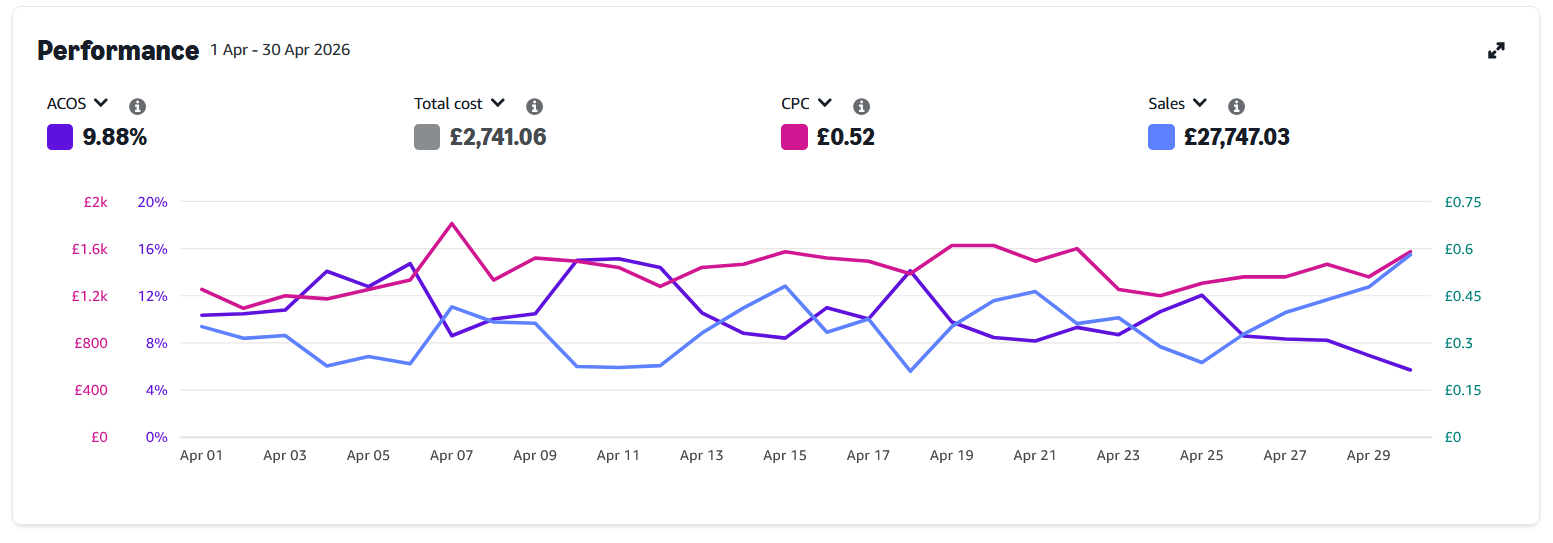
April 2026 PPC
9.88% ACoS, 10.1x ROAS and £0.52 CPC.
Advertising Console
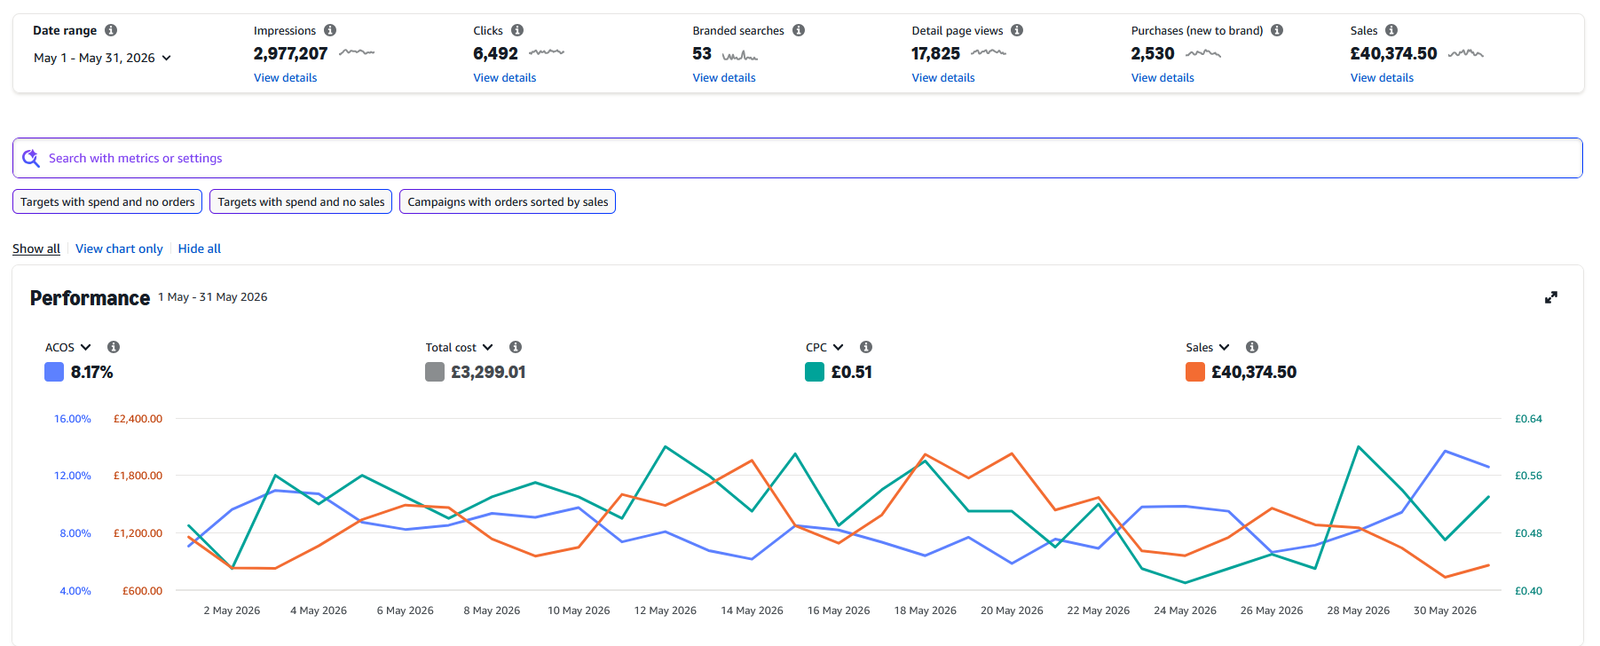
May 2026 PPC
8.17% ACoS, 12.2x ROAS, £0.51 CPC and £40,375 in ad-attributed sales.
Advertising Console
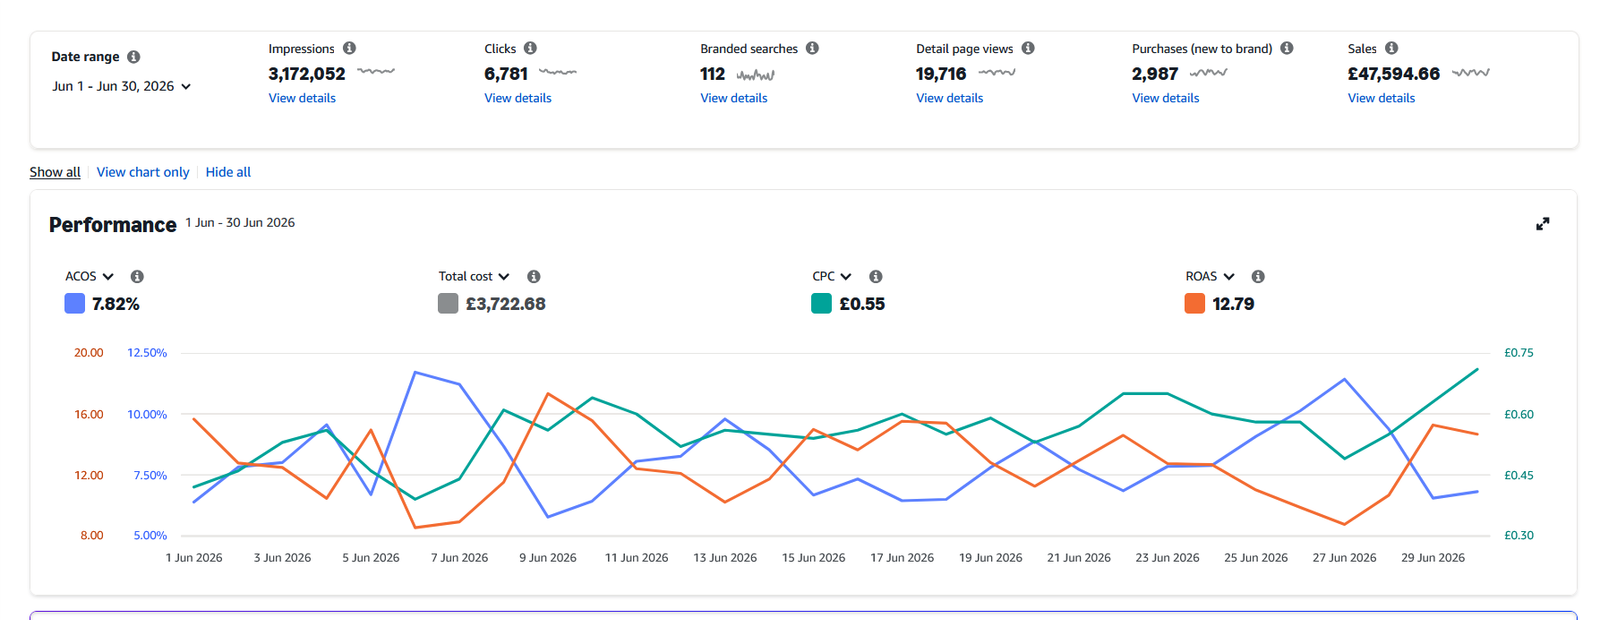
June 2026 PPC
7.82% ACoS, 12.79x ROAS, £0.55 CPC and £47,594.66 in ad-attributed sales.
Advertising Console
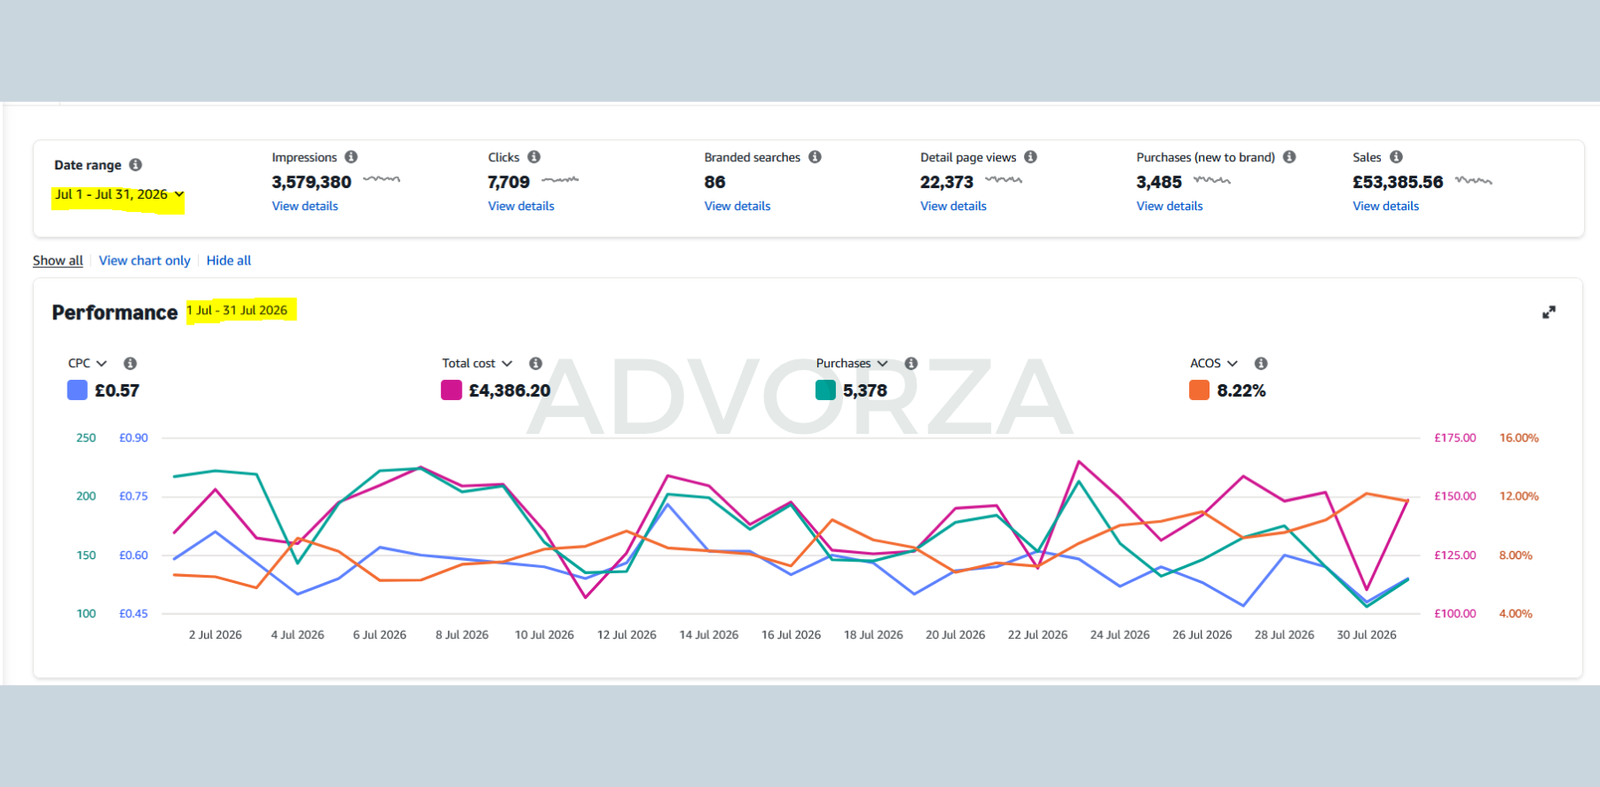
July 2026 PPC
8.22% ACoS, 12.29x ROAS, £0.57 CPC and £53,385.56 in ad-attributed sales.
Advertising Console
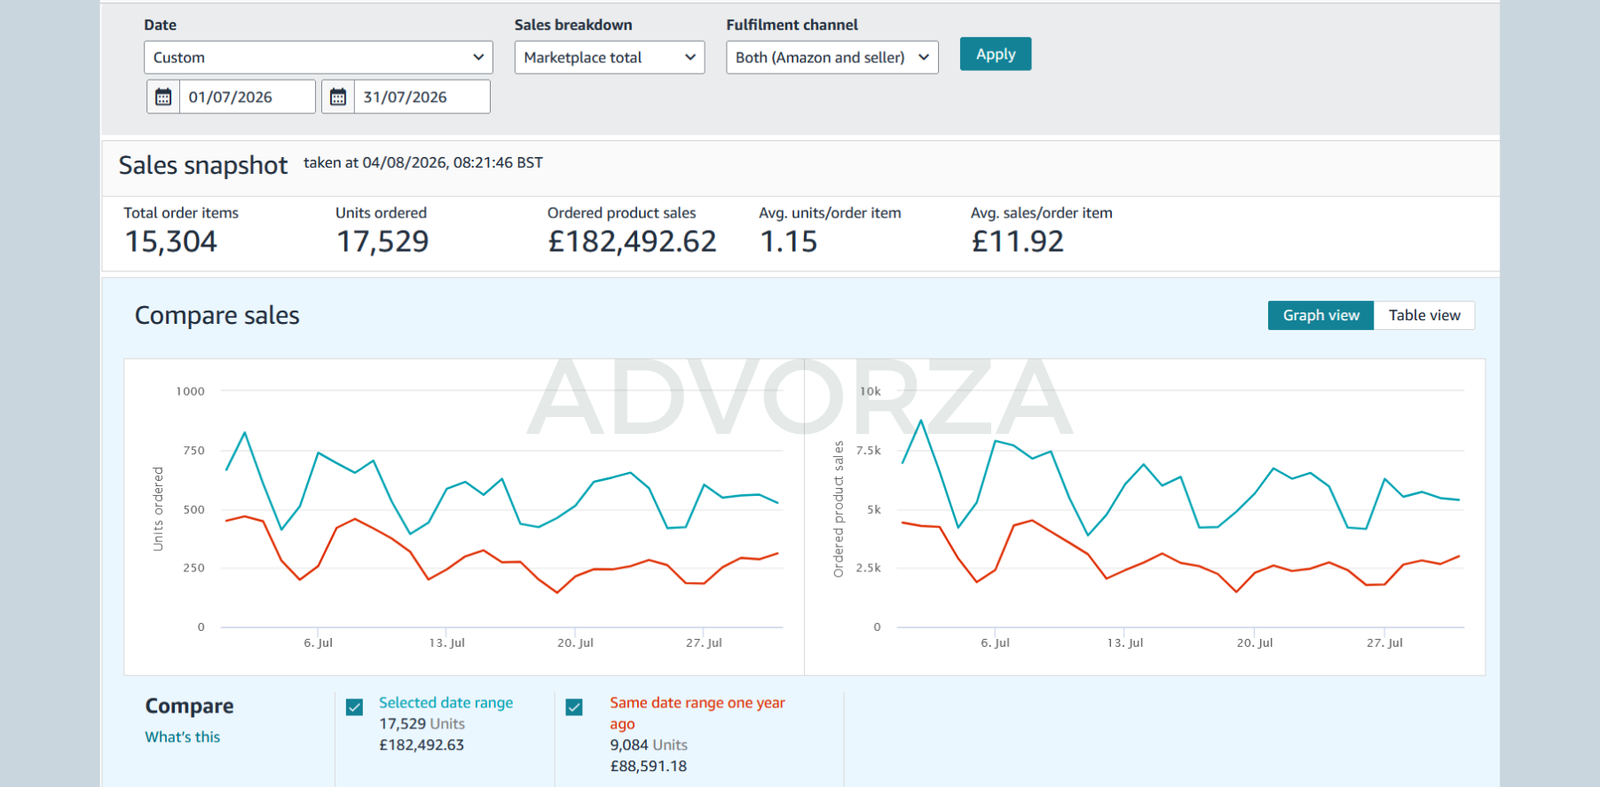
July 2026 total sales
£182,492.62 ordered product sales, 15,304 order items and 17,529 units.
Seller Central
Strong evidence, with the limits stated clearly.
A credible case study should show what happened without pretending one account predicts every future engagement.
This is one flagship account
The figures belong to one UK packaging and disposables brand. They are not blended results from several clients.
Results are not guaranteed
Performance depends on product economics, price, reviews, inventory, competition, seasonality and the client’s ability to execute agreed changes.
The proof is account-specific
Seller Central and Advertising Console screenshots support the published sales and advertising claims. Agency-wide experience is a separate track-record claim.
Confidential profit is not published
The brand is protected under NDA. Net-profit, estimated-payout and identifying account information remain private.
This is our flagship account, not our only work. Five years and $60M+ of managed Amazon revenue sit behind it. Older accounts predate our screenshot policy, so we do not label agency-wide experience as screenshot-verified.
Find the structural leaks hiding behind your ACoS.
We review your campaign architecture, search-term waste, listing constraints and the relationship between paid and total sales.
- Where branded, generic and competitor traffic are being blended.
- Search terms absorbing spend without useful conversion.
- Products whose margin cannot support the current ACoS.
- The first three changes we would make, in order.
We use your details only to respond to your enquiry. See our Privacy Policy.